

Are the statistics we see in articles about the Coronavirus accurate?
By Professor of Biostatistics Adrian Esterman
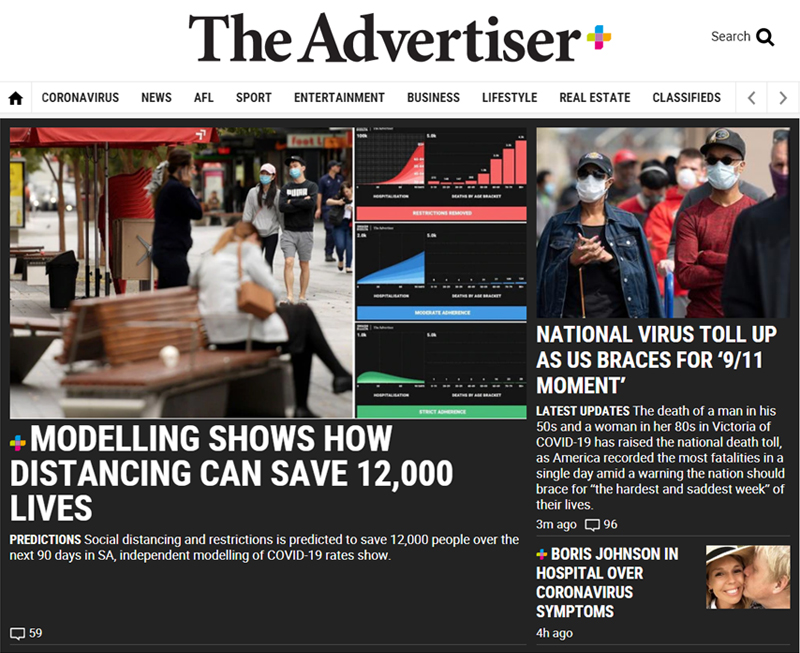 HEALTH Front page of The Adelaide Advertiser.
“Statistics show that of those who contract the habit of eating, very few survive.” – George Bernard Shaw
Are the statistics we see in articles about the Coronavirus accurate?
Well in brief, probably not. The reason is that every single statistic that is quoted is either an educated guess or has a heap of caveats or warnings attached to it which are usually barely or never mentioned. Let’s look at some of examples of the commonly used rates, parameters (numbers) or statistics that keep appearing in articles about COVID-19.
The epidemic curve
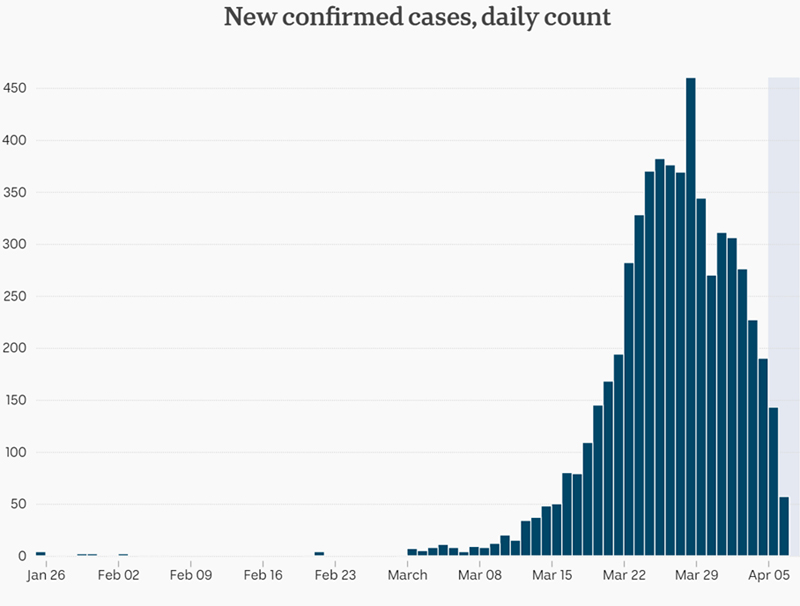 COVID-19 Epidemic curve for Australia. Source: ABC
The epidemic curve is actually a bar chart showing the number of newly diagnosed cases of COVID-19 on the Y or vertical axis, and the date or days from first diagnosed case on the horizontal or X-axis. With bar charts, the height of the bar represents the number of cases. Sounds simple?
I think it is safe to assume that the date is reasonably accurate! However, the number of newly diagnosed cases is highly dependent on two things: (a) the accuracy of the diagnostic test; and (b) the number of people tested each day. With respect to accuracy, some tests use nasal swabs, others throat swabs, and now we are just about to get finger prick testing for blood samples. Each of these has its own diagnostic accuracy, and if more than one of these is used for the same person, then it is possible for them to disagree.
As for testing rates, if the chance of being infected is spread evenly across the population, then if we double the number of tests, we double the number of diagnosed cases. If we do no testing, we have no diagnosed cases!
Therefore, epidemic curves are really only useful if the testing criteria (for example, those with symptoms) and rate of testing stay constant across the course of the epidemic. We can then interpret the patterns correctly. For example, if we see the number of daily cases starting to trend downwards (as in the chart above), then it is likely to be true.
The case fatality rate
This is the number of deaths from COVID-19 over a given period divided by the number of diagnosed cases. The top half of this rate, the number of deaths is likely to be reasonably accurate. However, the bottom half, the number of diagnosed cases suffers the same fate as the epidemic curve — it is very dependent on the rate of testing. For example, here is a graph I have created of case fatality rate by rate of testing for COVID-19.
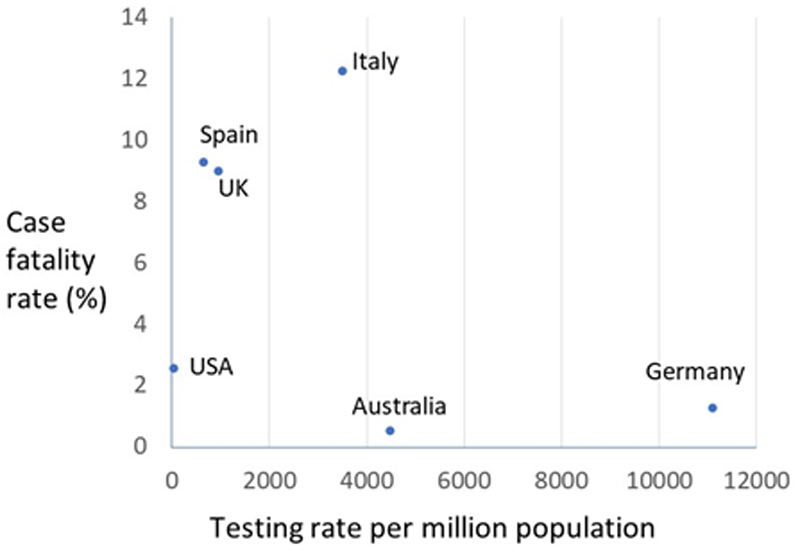 COVID-19 case fatality rate by testing rate for several countries.
By and large, those countries like Australia and Germany with the highest testing rates also have the lowest case fatality rates. Because of this, it is likely that the global case fatality rate is actually about 1 per cent.
Infectious period
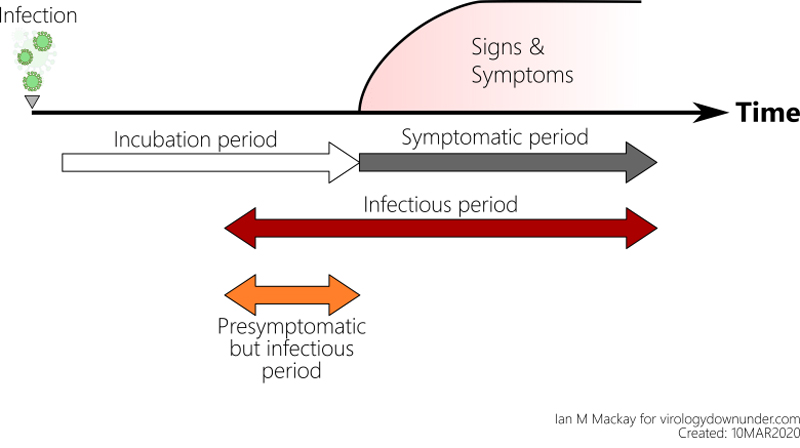 Infectious period.
This is the number of days on average each infected person can transmit the disease to someone else. The infectious period of an epidemic is very difficult to measure by direct observation. Instead, it is most usually measured from epidemic models, by observing patterns in households, or by observing “viral shedding” in volunteers. Each of these are only estimates.
R0
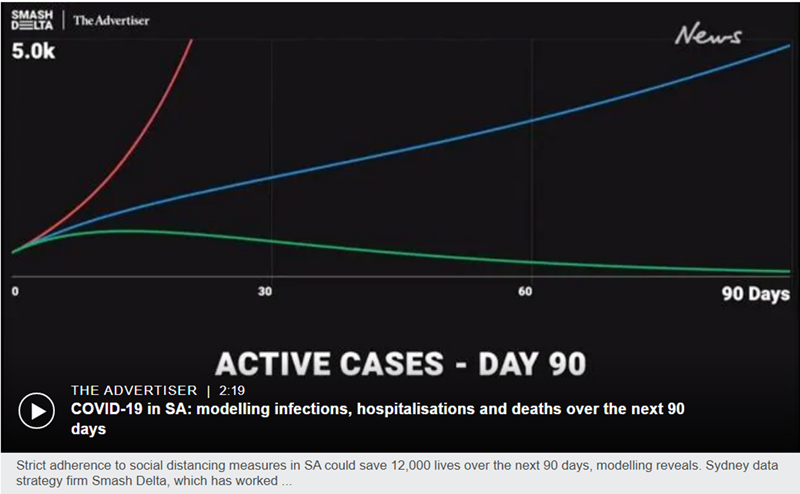 Graph showing the impact of strict adherence to social distancing (red), moderate adherence (blue), and strict adherence (green) on number of cases for South Australia. Graph courtesy The Adelaide Advertiser.
Ah! — the ubiquitous R0, the basic reproduction number. This is the average number of people each infected person infects. R0 is one of the key parameters or numbers used in infectious disease modelling, as seen above.
R0 is a function of three factors: (1) the number of contacts an infectious person has; (2) the risk of transmission per contact; and (3) the duration of infectiousness.
It is now widely known that while R0 is greater than 1, the epidemic will keep increasing. If we can get R0 down to 1, it will become endemic, that is it will be permanently in the population grumbling along at a low level. However, if we can get R0 below 1, the epidemic will die out.
However, R0 assumes that everyone in the population is susceptible — that is, they can be infected, and that there is a complete mixing of the population, that is everyone can come into contact with everyone else. Well this might be sort of true at the start of an epidemic, but it is certainly not true as the epidemic continues, due to people recovering and becoming immune, improved hygiene practices, and social distancing.
Most mathematical models are using an R0 for COVID-19 of 2.4. However, have you ever wondered how they actually estimate R0? Well they can get an estimate from individual level contact tracing at the start of an epidemic. However, more commonly it is estimated from population-level data using mathematical models. These models contain parameters like the three factors mentioned above, all of which are usually best estimates or educated guesses. Unfortunately, this makes R0 an educated guess as well!
So, by now you will have gathered that nothing is simple, even daily counts of cases, and that every statistic that is presented is based on estimates, clinical judgement, or educated guesses. However, don’t get too disheartened. Try and follow the patterns of what is happening during the pandemic, rather than relying on individual statistics. At least these are likely to be true as long as the rate of testing remains steady.
I do hope you enjoyed this article. I have written several others about COVID-19. Here are the links:
COVID-19 — facts and fiction
Infectious diseases and their impact on civilisation
Epidemiology and infectious diseases
A fascinating history of clinical trials from their beginnings in Babylon
This article was originally published on Medium. Read the original article.

Written by Professor Adrian Esterman, an epidemiologist and biostatistician
with over 40 years of experience. Foundation Chair of Biostatistics at the University of South of South Australia.
Other Stories
- Enterprise25: transforming in a time of disruption
- Are the statistics we see in articles about the Coronavirus accurate?
- Marnie Hughes-Warrington: Looking back to move forward
- UniSA clinics turn to telehealth to enable services and student placements to continue
- Achievements and Announcements
- Daddy day-care: new-look flexible work options, thanks to pandemic
- Watch this space: Emergent creativity in the time of COVID-19
- UniSA virus experts develop COVID-19 information and safety course
- Mixed news for women when it comes to radiotherapy: worse side effects but more likely to be cured
- Islamic pilgrimage lays the groundwork to accurately predict crowd numbers
- UniSA confirms long history of global business education excellence
- In Pictures: The Great UniSA Bake Off